by Steve Holroyd (laxmavn@aol.com)
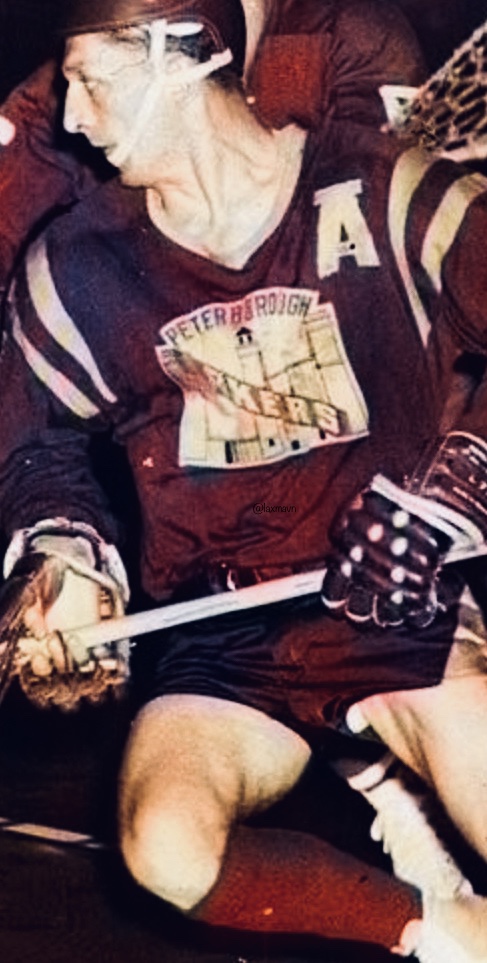
In the annals of box lacrosse, the name Johnny Davis conveys one image: goals. “Shooter” was a terror, leading two professional leagues in scoring (National Lacrosse Association (1968) and Eastern Professional Lacrosse League (1969)), and finishing in the top four for two others—the National Lacrosse League of 1972, and its better-known version of 1974-75. To many of a certain age, Davis is the personification of an attackman.
For some younger folks, however, that title might go to one of the Gait brothers, who terrorized the Major Indoor Lacrosse League and current version of the NLL from 1991 to 2005, with one brother or the other winning a scoring title in all but four of those years. Surely one of the Gait twins—whether Paul or Gary—must be the greatest scorer ever.

And what of Lionel “Big Train” Conacher, the Renaissance Man of Canadian sport? Besides playing for several NHL teams in the 1920s and 30s, helping to form the first professional gridiron football team in the Dominion, and knocking out Jack Dempsey in a boxing exhibition, Conacher scored 76 goals in 22 games for the Montreal Maroons of the International Professional Lacrosse Association of 1931. Surely the game had to be tougher back then…eh?
And what of latter-day goal scoring stars in the NLL—John Grant, Jr., Ryan Benesch, Curtis Dickson, and others. With the equipment goalies wear and the specialization in lacrosse tactics today, the current crop of attackmen must be the best box lacrosse has ever seen, and would have absolutely dominated in those older leagues.

Arguments like these are advanced in every sport, and are what make sports so much fun: we love to compare the great stars of different eras, and argue over who is the greatest of all time. Inevitably, the argument will veer in the direction of how a star from an older era had it so much tougher, and would thrive in today’s game. The rebuttal will usually say that a current star would have cleaned up in the old days, because he is better conditioned, received better training, and so on.
Ultimately, it is a subjective argument—with so many differences between eras and styles of play, it is impossible to get an apples-to-apples comparison between a player from the wooden stick era and one who is playing today.
Or is it?
As baseball SABRmetricians have demonstrated, it is possible to use analytics to attempt to account for the various differences among different eras, leveling the playing field and placing the players under consideration on an equal footing. While there will never be a perfect comparison, use of data can allow us to consider the question on a relatively equal footing.
Some of the “smoothing” process is basic—accounting for the different numbers of games played in the various leagues. Other parts are a bit more complex: taking into account the strength of competition in any given year. But the tools are all there.
So buckle up as we examine who had the greatest scoring seasons in professional lacrosse history—based on the standards of today.
Dispelling some myths
Before even getting into the weeds, many fans will immediately poo-poo the mere suggestion that such a comparison is possible. “Scoring is so easy today,” say the old timers, “what with NLL goals being bigger, better equipment, the wussification of defensive play and the fact that no one plays on both sides of the ball anymore. Johnny Davis would have scored 300 goals a year if he only had to play offense and got to waltz his way to a bigger net with today’s sticks.” Current fans would offer the inevitable reply: “Sure, nets are bigger…but the goalies are all dressed like the Michelin Man, filling up every nook and cranny of the net. Sure, we have offensive specialization—but also defensive specialization…Kevin Crowley doesn’t get to expose a tired offensive player with no defensive skill like Paul Suggate used to. It’s harder to score today.”
So let’s address this issue right up front:
Scoring is harder to come by today than it was in prior leagues
Look, it’s simple—if scoring goals were easier in a certain era, we would expect to see more goals per game at that time. Makes sense, right? So let’s see how the various professional leagues have fared over the nearly 90 years box lacrosse has been in existence.
Before doing so, let’s take a look at the professional leagues we will be comparing.
First, let us recall that, when we are talking box lacrosse, “professional” is a pretty loose term. Even in the days of the National Lacrosse League of 1974-75 (probably the “most professional” league when one considers the length of season and such), the very best players only earned about $32,000 for the season (about $171,000 in 2019 dollars) which, while impressive by today’s professional lacrosse standards, is not much when compared to other sports. As a result, our list will include leagues which held themselves out as “professional.” They were:
International Professional Lacrosse Association (1931) This first attempt at pro boxla lasted one full season and parts of a second. Notwithstanding its grand name, it actually only consisted of four teams from Canada. While not around very long, two of its teams featured in the first box lacrosse match ever played in Madison Square Garden in 1932.
National Lacrosse Association (1968) After three other attempts at pro boxla in the United States failed, it was another 35 years before Morley Kells and Jim Bishop would convince some NHL magnates to attempt a pro boxla league. With four teams in the east, and the long-standing Western Lacrosse Association agreeing to go professional for the experiment, the NLA lasted one year before, essentially, splitting into two separate leagues the following season.
Eastern Professional Lacrosse League (1969) Minus the Detroit Olympics and Montreal Canadiens (owned by those cities’ respective NHL teams), the eastern division of the NLA carried on in 1969, adding new teams in the process. While the Western Lacrosse Association also staged a professional season that year (the winners of the two leagues faced off in a “world series” that year), it is not included in our list because that league did not use a shot clock
National Lacrosse League (1972) Jim Bishop tried again at forming a national, professional lacrosse league in 1972, and originally counted on participation of the WLA. The latter decided to forgo the professional route, however, so the NLL went it alone as an eastern circuit. Although there was very limited interleague play, this NLL was basically a (barely) professional version of what is known today as the Ontario Major Series. More about this league can be read here.
National Lacrosse League (1974-75) Perhaps still the most fondly remembered of all professional box lacrosse leagues, this circuit—again largely the result of Bishop and Kells’ efforts—lasted two seasons, and was headed to a third despite inconsistent attendances before a series of unfortunate circumstances (primarily, the unavailability of the Montreal Forum due to the 1976 Summer Olympics) forced the league to fold up shop.
Eagle League/Major Indoor Lacrosse League/National Lacrosse League (1987-present) Our current league which, for the purposes of some of our discussion, will be split between its “single entity” era (1987-96) and the time from when it rebranded as the National Lacrosse League (1997)
National Lacrosse League (1991) Prompted by the modest success of the MILL, Canada tried its own version of low-key professional lacrosse in 1991, lasting only one year. Read more about it here.
So having introduced the leagues, let us make our comparions:
International Professional Lacrosse Association (1931) 17 goals per game (GPG)
National Lacrosse Association (1968) 22.2 GPG
Eastern Professional Lacrosse League (1969) 26.8 GPG
National Lacrosse League (1972) 29.3 GPG
National Lacrosse League (1974-75) 30.1 GPG
National Lacrosse League (1991) 28.7 GPG
Eagle League/Major Indoor Lacrosse League (1987-96) 26.6 GPG
National Lacrosse League (1997-2019) 24.5 GPG
The numbers speak for themselves—the current version of the NLL has produced the fewest goals per game than in any other era (with two exceptions, which will be addressed momentarily). Indeed, even if you include the entire history of that league (i.e., including the “single entity” era of MILL), that number is only 24.6 GPG.
The two exceptions (the IPLA and NLA) can be easily explained away. The ILPA was the first season of box lacrosse anywhere—the sport had literally been invented for that league. As a result, this “early installment weirdness” cannot provide a reliable data set. More to the point: the ILPA lacked a shot clock.
The absence (or, at least, partial absence) of a shot clock is also responsible for the lower GPG total in the National Lacrosse Association. That circuit—the first attempt at professional box lacrosse in the modern sports era (i.e., post-1960)—essentially consisted of two separate leagues: a professionalized Western Lacrosse Association and an eastern division of teams. The latter group instituted a 45-second shot clock, while the WLA did not. Simply taking the goals scored by the eastern teams, the GPG still only increases to 22.5—however, this number is still probably a little low due to the limited number of interdivision games played (each eastern division team played teams from the other division twice).
But look at the “major” National Lacrosse League of the 1970s—five and a half more goals per game were being scored in the “original” NLL (as most tend to ignore the 1972 version) than today—over 25% more goals per game. So, with wooden sticks, having to play both ways, getting assaulted on defense, shooting at a smaller net, and playing on wooden floors, the stars of the past still had an easier time scoring goals.
“Well, that was the best league ever. What did you expect? Those players would have scored even more goals today!” Alas, this argument substitutes nostalgia for facts. If you had the “best players ever,” wouldn’t that also include the goaltenders…who, apparently, weren’t faring as well? Actually, the goaltenders of that era were quite good. But their allowing more goals is the be expected—the “original” NLL footage we have available features goalies with nowhere near the level of padding seen in today’s netminders.
So we are clear: this does not suggest that the great stars of the 1974-75 NLL are “overrated.” In many ways, the approximately 25% reduction in offense is likely attributable to the rise of defensive tactics, such as the specialization now seen between offense and defense, as well as improvements in goalkeeper equipment. Bear in mind, also—all sports find defense catching up to offense at some point, resulting in rule changes to make the game more offensive again. The increase in goal sizes notwithstanding, the current NLL’s rules have remained relatively static over the years, allowing defense to creep up and limit the number of goals scored per game.
Defense always wins
Take, for example, the Eagle League of 1987. The first year of the current NLL played a very limited schedule (6 games), and mostly featured collegiate field lacrosse players. However, that league averaged 28 GPG. Jump to 1993, when Canadians started to feature more prominently (and often overwhelmed the former field lax players), and the GPG is still a healthy 27.4. The first year of the rebranded NLL (1997) finds a still respectable 27.6.
By 2004, however, that number drops to 24.6 GPG—essentially the league’s historic average. Did NLL players get worse? Hardly. This is just the reality that, in sports: defense always catches up to offense at some point; rules are changed to benefit offense; and defense again finds a way to catch up to offense.
The “defense always catches up with offense” maxim can be seen by reviewing the steady decline in GPG in the NLL. In 2002, the NLL increased the size of the goals from 4’6” to 4’9”, but this change had little effect in promoting offense—presumably because goalie gear just got bigger in response. In 2012, however, the league instituted a number of rules to speed up the game (the “backcourt” rule was reduced from 10 seconds to 8; defensemen were no longer permitted to use 46” sticks, and had to use 42” sticks; three goals needed to be scored before a 5 minute penalty would be cancelled), and this had the desired effect:
2010 22.3 GPG
2011 21.9 GPG
2012 24.2 GPG
An almost three goal-per-game increase resulted from the changes. But note how the defense has adjusted over the following seven years:
2013 24.1 GPG
2014 22.7 GPG
2015 22.7 GPG
2016 24.2 GPG
2017 24.3 GPG
2018 24.7 GPG
2019 22.5 GPG
Within two years of the rules changes, the NLL’s GPG had returned to the pre-change levels. While it then jumped up again (as offense found ways to counter the adjustments), it has since returned to pre-change levels—inevitably, as offense and defense jockeys for supremacy, offense inevitable runs out of room until more room (via rule changes) are created.
Defense vs. Offense in hockey
In broadest terms, hockey provides the best example of how defense catches up with offense every time. From the start of the Great Expansion of 1967-68 (when the league doubled in size from 6 to 12 teams), the league’s goals against average hovered between to 2.79 to 2.98 goals per game—a number consistent with figures during the Original Six era.[1] Essentially, there were so many good players languishing in the minors that the rapid expansion had little effect on the overall talent on the ice.
Recall, however, that at the time only Canadians played in the NHL. While a handful of Americans dotted rosters, the number of talented U.S. players was very low, and would continue to be so until the “Miracle on Ice” during the 1980 Winter Olympics started a hockey boom which would, eventually, start producing star-level players. Also, the attitudes of the time continued to eschew European players as “too soft” for the NHL. Russians players were, of course, completely unavailable—and were not particularly desired, as they, too, were seen as “soft”—at least until their near-upset of Canadian pros during the 1972 Summit Series.
Continued expansion would soon have an effect on GPG totals, however. As most hockey experts will tell you, it takes longer to develop quality defensemen (even today, defensemen who were high draft picks tend to stay in the minors longer for “seasoning”), and quality blueliners are generally fewer and further between than offensive stars. Same with goaltenders. As a result, while the addition of the “Second Six” appeared to be just the right number of teams to accommodate the number of NHL-caliber players languishing in the AHL and WHL, continued expansion would soon tax the talent pool available.
For instance, the NHL expanded again in 1970-71, adding two teams. That year, the league’s GPG jumped to 3.12. As Anatoly Dyatlov from HBO’s Chernobyl might say, “not great, not terrible.” But by 1972-73, this number skyrocketed to 3.28. So what is happening?
Recall that in, 1972, the NHL not only expanded by two more teams, but the World Hockey Association also began play that year, with 12 teams. As a result, in the space of five years, the number of teams in “major league” hockey had jumped from six to twenty-eight. Simply put: there were not enough good Canadian players to fill the available roster spots.[2]
In the absence of available quality defensemen, teams adopted other tactics to try to slow offense, which led to “intimidation” as a tactic. The Age of Goonery had begun.
By 1979-80, the WHA had essentially merged with the NHL (it was dubbed an “expansion” to avoid thorny anti-trust issues), and the NHL was now a 21-team league. The NHL’s GPG that year was 3.51—an all-time high (at least since defensive rule changes, allowing goalies to flop, took place in the 1920s). But it was about to get worse.
Recognizing that there was simply not enough good Canadian talent, teams finally began to embrace the importation of European players into the league—primarily on offense. With the U.S.’s improbable gold medal win in 1980, American players were no longer casually dismissed as inferior. Led by a kid named Wayne Gretzky, offense was about to overrun defense in an era that has been dubbed the “Air Hockey Era” by hockey analytics folks.
From 1981 to 1986, NHL GPG figures were:
1980-81 3.84
1981-82 4.01
1982-83 3.86
1983-84 3.94
1984-85 3.89
1985-86 3.97
Eventually, however, defensemen began to catch up, and defensive tactics began to counteract the speed and skill of offensive players. It was not until after the first NHL lockout of 2004-05 that we saw defense overwhelm offense: the beginning of the “Dead Puck Era.”
In 1993-94, the NHL saw a healthy 3.24 GPG. In the following, lockout-shortened season, that total plummeted to 2.99 GPG. In the years that followed, NHL GPG were:
1995-96 3.14
1996-97 2.92
1997-98 2.64
1998-99 2.63
1999-2000 2.75
2000-01 2.76
2001-02 2.62
2002-03 2.65
2003-04 2.57
With “clutch and grab”/neutral zone trap in full bloom, and goaltenders’ equipment reaching ridiculous sizes, the NHL had the lowest GPG numbers since the late 1950s during this run. Fans were beginning to get bored.
With the entire 2004-05 season lost due to the NHL’s lockout of the players, it was not until the following season that skaters got to return to the ice. With them came a number of rule changes, designed to return offense to the game: among them, the size of goalie equipment reduced by 11%; line changes no longer permitted by the offending team immediately following an icing; two-line passes were now permitted; and referees were instructed to clamp down on interference penalties. The immediate result: a jump to 3.08 GPG. Defenses would soon adjust, and that total would gradually dwindle down to the 2.7 range for most of the 10s.
So what’s your point?
Ultimately, it comes down to this:
Clearly, goals were easier to come by in the 1974-75 version of the National Lacrosse League. However, if that league had survived, it is fair to assume that defensive tactics would have evolved to the point that, as in the NHL and current NLL, GPG would have eventually come down to the historic average we see today (24.6).
As a result, the mere fact that Paul Suggate, Rick Dudley, Larry Lloyd, et al. could score as many goals that they did does not—by itself—mean they were the greatest of all time. At the same time, those 1970s NLL goal totals do not mean that it was an easy league to score in, and that the players who scored in that era have “inflated” stats.
Similarly, it does not necessarily mean that current NLL players are better (or worse) simply because that league’s GPG figures are lower than that of its predecessor.
What it does mean, however, is that the GPG data does not support the broad claim that players in the “old days” had a harder time of scoring. If anything, all things considered, they had an easier time and, while that might have eventually changed had the 1970s NLL lasted long enough for defense to catch up with offense, based on what we know today it looks as if goals came more cheaply back then.
History has shown, however, that those original NLL numbers would have gone down, and would have probably come closer to the GPG figures we see today. So, for the sake of continued argument, let us go forward on this assumption: all the great players in professional box lacrosse have been relatively equal.
Or have they? As we have seen, GPG fluctuates more on the basis of rule changes and tactical adjustments than on the skill of the players involved. As a result, maybe we should not worry about raw goal totals and, instead, focus on the quality of competition in the different eras.
The Competitive Index
Both in Moving The Goalposts, by Rob Jovanovic (Pitch Publishing, 2012) and The Hockey Compendium by Jeff Klein and Karl Eric Reif(McClelland & Stewart, Ltd., 2001 (2d Ed.)), the authors—in applying statistical analysis to soccer and hockey, respectively—recognized that now all seasons were created equally. The latter pair created a “spread of competition” metric, which Jovanovic refined to create what he calls the “Competitive Index” (“CI”). With this simple measure, one could compare leagues from different decades which would not only take into account the different numbers of games played in a season, but also try to take into account whether a particular season was “competitive” (i.e., the teams were evenly matched), or whether a particular year was non-competitive because there were some really dominant and/or really poor teams playing that year. As Jovanovic explained:
A basic, but telling, way of doing this is as follows. First, work out the percentage of points obtained by the champions and for the team finishing bottom of the table. By subtracting the latter from the former I got a figure for each division I decided to call, for no particular reason, the Competitive Index (CI). The most uncompetitive league would see the champions win every game, 100% of available points, and the last team would lose every game for 0% of the points so the CI would be the maximum 100%. Conversely, the closest-fought league would see everyone draw all of the games and be equal on 50% and so the CI would be 0%. In reality most leagues are somewhere between the two, usually between 30% and 60%.
In a previous article, we gave some examples of which years were particularly competitive, and which were especially laughable. We can now use this strength of competition to try to “smooth” the different eras and make a side-by-side comparison of great lacrosse scorers across different eras.
Setting the table
As we undertake our deep dive into previous scoring records, some numbers are immediately eye-catching. Paul Suggate’s 115 goals for Maryland Arrows in 1974 looks mind-blowing by today’s standards. Dhane Smith’s 72 goals in only 18 games for Buffalo Bandits in 2016 is also pretty impressive…but maybe not as impressive as Athan Iannucci’s 71 goals for Philadelphia Wings in 2008—which had him scoring almost 4.5 goals per game.
There is a tendency to dismiss truly mind-blowing numbers as mere flukes, but this is unfair. However, in all North American sports, special athletes have managed to have incredible seasons which, to modern eyes, appear statistically impossible to equal today. Baseball has two well-known examples: Jack Chesbro’s 41 wins in 1904 for the New York Highlanders (now Yankees), and Roger Maris’ 61 home runs in 1961 with the Yankees (which, for reasons that would warrant their own article, is always mentioned alongside Babe Ruth’s 60 home runs in 1927). Today, where a pitcher is having a great season if he manages to get to 20 wins, and 45 home runs is considered a prodigious effort, those numbers look like something out of a video game. Nevertheless, they are real.
(Yes, I am ignoring Barry Bonds’ 73 home runs in 2001—you can guess why.)
Other sports also feature records that seem to be so off-the-scale that our instinct is to simply poo-poo them. In basketball, Wilt Chamberlain’s averaging 50.4 points per game in 1961-62 for the Philadelphia (now Golden State) Warriors boggles the imagination. In hockey, Wayne Gretzky potted 92 goals in 1981-82 for the Edmonton Oilers, eclipsing the previous record by 16 goals.
These are all real numbers. The records exist. To ignore them because they are too great, or simply “old,” is simply not fair to the men who set them.
While it is wrong to simply dismiss truly epic single-season records as being “too good to be true,” or “old,” it is fair to consider some of the factors that may have contributed to their existence, and to try to “smooth” the numbers to come up with a figure that is more in line with what we would expect to see today.
In the case of the three attackmen mentioned above, each played in seasons with different numbers of games. However, while simply adjusting for games played is fair, it does not tell the whole story. While summarily disregarding records as “old” is unfair, it is legitimate to consider some of the factors that might have contributed to their existence. For example, it is pretty much taken as a given that Gretzky’s remarkable record was possible, in no small part, because of the “Air Hockey Era” referenced earlier. Similarly, it is often suggested Maris was able to hit 61 home runs because the American League had expanded by two teams that year, diluting the pitching talent.
Of course, there are other factors at play besides expansion—styles of play, tactics, etc. Consider baseball—in 1904, Chesbro was starting (finishing most games) and relieving, because that is what pitchers did back then, so he had plenty of “win opportunities” not available to pitchers today; in 1927, Ruth could feast on starters who were expected to pace themselves, and would often labor into the later innings, as opposed to today’s batters who are seeing 90+ MPH fastballs in every at bat.
Similar influences occur in lacrosse. As we have seen, Suggate played in an era when goals were easier to come by, notwithstanding the fact he was expected to play on both sides of the ball. Conversely, Smith may have benefitted from superior equipment and an era of offensive specialization. (Or that—as Wings’ fans not-so-fondly recall—Iannucci may have benefitted from Philadelphia’s changed its entire offensive set up just to get him goals in 2008.)
Thus, while simply taking a player’s goals-per-game figure and multiplying it by a standard number of games played is a start, it will not take into account factors like those described above. And, while there is no perfect way to account for these various influences, CI does allow us to at least take into account relative strength of competition in a given year to give us a truer adjusted number for goals scored in a season.
Playing it forward
To demonstrate, we will use Suggate’s and Iannucci’s record seasons, and also add a Gary Gait season (30 goals in 1995 with Philadelphia Wings).

First, in order to “standardize” the numbers, Suggate, Gait, and Iannucci’s seasons must be adjusted to reflect the NLL’s current 18 game schedule (fortunately, as all three men played in every game, this is easier than if we had to account for games missed). By simply taking their goals-per-game and multiplying it by 18, we see that Suggate would score 52 goals, Gait would score 68 goals, while Iannucci would net 80 goals.
Having done that, we can now adjust for competitive imbalances.
Under CI, the most competitive season would be a 0; as a result, the closer to zero your CI is, the “harder” it is to compete.
Since 1987, the NLL’s average CI is 55.3 (for the curious, 2019 came in at a 55.6 CI). Since we are trying to determine how the scorers of the past would do in a “regular” 18-game NLL season, this is our standard.
In the case of Suggate, Gait, and Iannucci, the CIs of their seasons were:
1974 36.3
1995 62.5
2008 37.5
Loosely speaking, Suggate and Iannucci had to work harder for their goals compared to an “average” NLL season, while Gait had it a little easier.
Using the CIs from each season, we can make some adjustments to the “raw” Goals/18 figure we arrived at earlier. We can estimate that the 1995 season was only 88.5% as competitive as the average NLL season, and the 1974 and 2008 seasons were roughly 49% more competitive. As a result, the totals of Suggate, Gait, and Iannucci, “adjusted for inflation,” result in these numbers for an “average” NLL season:
Paul Suggate 79
Gary Gait 60
Athan Iannucci 118
Again, CI is not the final word. However, these numbers are not out-of-line for what you might expect from stars of Suggate and Gait’s magnitude; Suggate’s adjusted season would break the current record, for instance.
Having laid out the basic parameters of how CI can be used to further adjust a goal-per-game average, let’s take a look at how the leading goal scorers in each professional season (in a league with a shot clock) would have fared in an average NLL season.
The Top 20:
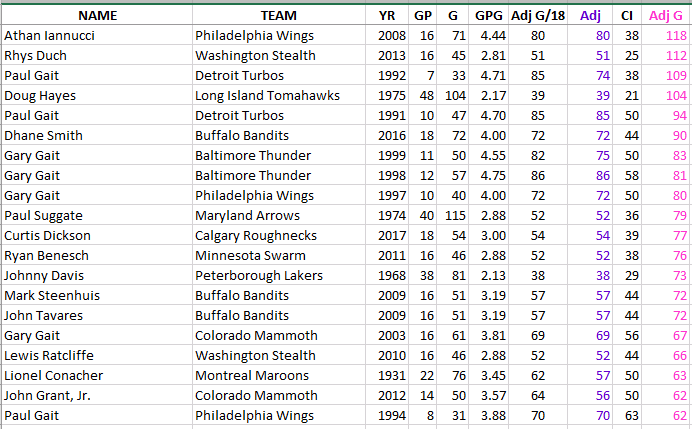
Looking at the adjusted numbers, we see the great players of the past would still post great numbers today (for the fun of it, I included Conacher’s 1931 season, even though it is an outlier).
In some cases, the adjusted numbers are more impressive than the real ones: Iannucci’s 2008 season is off the charts—but, then again, as in Wilt Chamberlain’s 100-game in 1962, anything is possible when your teammates are doing everything they can to get you the ball. Similarly, Rhys Duch’s 2013 might be a bit inflated, as a function of the fact that he played in the second-most competitive season in professional lacrosse history. And, curiously, Doug Hayes’ adjusted numbers equals the exact amount of goals that he scored in 48 games in 1975—the most competitive season in professional lacrosse history.
But are we done yet?
Having accounted for relative strength of schedule, shouldn’t we now account for relative ease in scoring goals in a given year? As we’ve seen, in some years it was easier to score than others. Taking the historic NLL average of goals per game by team (i.e., half of 24.6) and comparing individual seasons against that gives us another percentage we can apply against the goals adjusted for by CI. Here’s that Top 20:
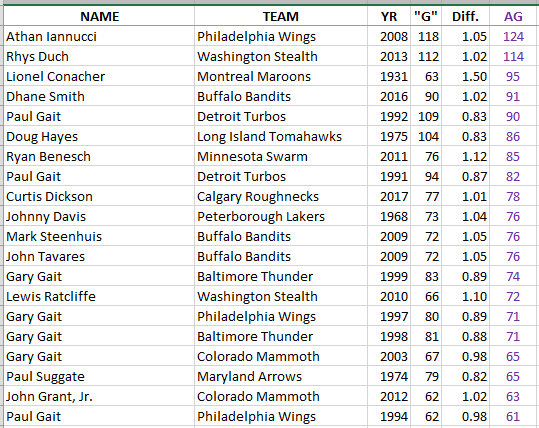
Even with this further “smoothing,” we still have a list where only 13 people are breaking the current NLL single season scoring record of 72. And, again—while the 1931 season remains a real wild card, it is still interesting to see the probable greatness of Lionel Conacher in any era. Finally—for all the shade some like to throw on Iannucci’s career year, it really does appear to have been one for the books.
Summary
To emphasize: no one is claiming that these numbers are absolute. As was mentioned on several occasions—and apples-to-apples comparison will always be impossible. Different eras will always be different; rule and equipment changes, tactical variations, changes in fitness regimens—all of these factors make true comparison across eras hypothetical, at best.
Nevertheless, the use of analytics at least allow a closer
comparison than raw numbers themselves would allow. And, using those analytics, we find that
great players are great—regardless of when they played.
[1] NHL GPG numbers come from https://www.hockey-reference.com/leagues/stats.html (retrieved February 5, 2020)
[2] Interestingly, expansion has not had a similar effect on the NLL. By way of brief example: in 2018, the league had 24.7 GPG. In 2020, with four new teams added in the course of two years, the figure is actually lower, at 21.5 (as of February 2, 2020). As opposed to hockey, there are apparently more than enough quality lacrosse players in the Arena Lacrosse League, Western Lacrosse Association, and coming out of the NCAA to fill the spaces as the NLL expands.

