by Steve Holroyd (laxmavn@aol.com)
More than in any other country, professional sports takes up a huge place in American life. As the Super Bowl™ reminds us, the annual professional football championship has become an unofficial national holiday, with millions of people grinding their daily lives to a halt in order to watch the big game.
Our fascination with sports goes beyond events like the Super Bowl™. We are fascinated by the teams, and the players making up those teams. Further, that fascination extends to the history of each respective sport. Dozens of films, hundreds of books, and thousands of hours of conversation in bars and living rooms have been devoted to such age-old questions as “was Jordan better than Wilt,” “is today’s NHL weaker than the ‘Original Six’ era,” “could Jim Brown run for 2,000 yards in today’s NFL,” and “are the 1927 Yankees really the greatest baseball team ever”?
As we at CrosseCheck have brought more and more film and articles about stars of the past to the surface, one can imagine similar discussions popping up among boxla fans. People can read about the goal scoring exploits of Johnny Davis and Paul Suggate—or of the greatness of those original Philadelphia Wings teams of the 1970s—and wonder “how would they fare today”? Other fans may wonder whether such comparisons are even appropriate, as changes in equipment (plastic sticks, goalie gear), tactics (no one plays both sides of the ball anymore) and rules (goal sizes, etc.) make comparing different eras really difficult.
Obviously, lacrosse’s somewhat erratic professional history cannot be changed. However, I have tried to find new ways to make history relevant for boxla fans by attempting to create a “link” like other sports enjoy. While the current Philadelphia Wings are not the original Philadelphia Wings (or, indeed, even the second Wings), all three teams are a part of the city’s lacrosse history. The same goes for other cities.

We have had three major professional leagues in North America—the National Lacrosse Association (1968), the original National Lacrosse League (1974-75), and the current NLL, which has existed under a variety of names since 1987. Even though there are gaps between these three leagues—and even “internal” gaps in the current NLL—there must be way to bring them together in a way that will give lacrosse fans some sense of a “link,” even if somewhat manufactured, that will allow a deeper appreciation of professional boxla history.
Stats to the rescue
As noted, I have long had these ideas in mind. And it was with these thoughts in mind that I came across Moving The Goalposts, by Rob Jovanovic (Pitch Publishing, 2012). The author himself, after noting the obvious influence of Bill James and Moneyball on all sports, says:
Moving The Goalposts hopefully provides a refreshing look at the aspects of [soccer] that have previously been overlooked, ignored, taken for granted or just plain misinterpreted. It aims to uncover numerous hidden truths about the game and explain why certain myths survive to this day….
The book itself makes wonderful use of statistical analysis and, even bearing in mind the famous maxim “lies, damned lies, and statistics,” makes a pretty compelling case for its various theories. (To find out what those are, exactly, you’ll have to buy the book.)
Of course, the book focuses primarily on soccer—and English football, in particular.. However, a number of the concepts are easily applicable to lacrosse, if only someone had the data….
Oh, yeah…that’s where CrosseCheck comes in. We do have the data!
First, some background. All professional lacrosse leagues have used a playoff system to determine an ultimate champion—as do all other North American professional sports. But fluky playoff runs and shocking upsets should not allow sustained excellence over the course of a season by a team be summarily ignored. As a result, regular season results provide the best evidence of how a season went…and of how good or bad a particular team might be. Even this is problematic, though, as—with few exceptions—the three pro box leagues have not played balanced schedules. But it is the best we have.
Against this backdrop, my first task was the “standardize” all of the league tables from the NLA, NLL I, and NLL II to date. To do this, I eliminated divisions and conferences, and awarded the standard points for wins and losses for the era—or for ties, which existed in the NLA and NLL I (essentially, using points—as in soccer—is practically equal to winning percentage; as all teams in our three leagues played the same amount of games, it is a distinction without a difference).
Having put all three leagues on as equal footing as possible, I was able to start applying MTG to pro boxla history.
Were the “Good Old Days” really good?
We’ve all heard variations on the same theme: “Stan Musial would have chewed up today’s pitching”…”Mario Lemieux would have scored 100 goals a year now that clutch-and-grab is out of hockey”…nostalgia always prompts us to believe that things were better in sports then than they are now.
Similarly, there are fans today that remember the original NLL, and will flatly state that the lacrosse there was infinitely better than today’s game.
So was lacrosse better then, or is it better today?
As Jovanovic notes, “better” is impossible to define—a better barometer might be “competitive.” So how does one determine “competitive”?
Jovanovic uses “percentage of available points won” as the basic scale to measure such things. Loosely translated, you can think “winning percentage,” although (because of the presence of ties) the two are not identical. Anyway, this percentage is useful because it takes into account such factors as different numbers of games played per season.
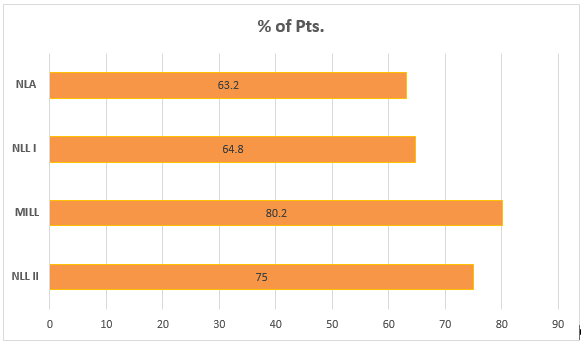
The graph above shows how the “league champions” (again, those who would have won a single-table league, not necessarily the actual champions (i.e., playoff winners)) have won a fewer percentage of available points in the first two boxla leagues than in the current NLL (which, for purposes of later discussion, I separated into MILL and NLL eras—combined, NLL II gets a 76.5 number). This is a bit surprising, given some assumptions that come with the fact that—while not making anyone rich—both NLA and NLL I paid players a bit better than NLL II (particularly in the MILL era), so a better level of talent across-the-board might be expected.
So this tells us what we have long accepted as fact is incorrect, right? The “good old days” weren’t really so good, and we are now watching the best pro lacrosse ever. Case closed.
Not so fast. While it is clear league champions were more dominant in the “modern era” of NLL II, this does not mean much if the dominance was the result of one team running roughshod through a bunch of weak sisters—which, indeed, was the case in the early 1990s when experienced Canadian pros entered the then-MILL and dominated what had been predominantly a league of ex-college field players. The better question might be how competitive was the league as a whole. Stated another way, in which league is it harder to win points?
The Competitive Index
In MTG, Jovanovic devised a straightforward method of comparing the competitiveness of each league. With this simple measure, one could compare leagues from different decades which would take into account the different numbers of games played in a season and whether two or three points were awarded for a win. As he explains:
A basic, but telling, way of doing this is as follows. First, work out the percentage of points obtained by the champions and for the team finishing bottom of the table. By subtracting the latter from the former I got a figure for each division I decided to call, for no particular reason, the Competitive Index (CI). The most uncompetitive league would see the champions win every game, 100% of available points, and the last team would lose every game for 0% of the points so the CI would be the maximum 100%. Conversely, the closest-fought league would see everyone draw all of the games and be equal on 50% and so the CI would be 0%. In reality most leagues are somewhere between the two, usually between 30% and 60%.
So how competitive are/were the attempts at professional box lacrosse over the years
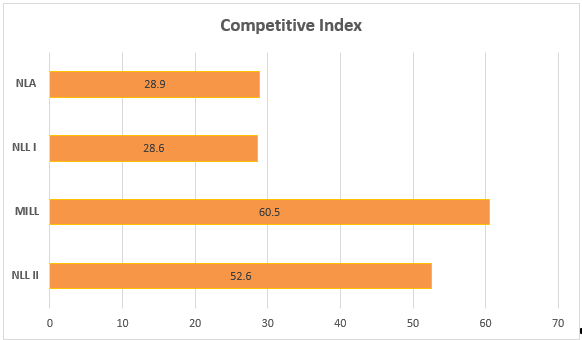
And now we see why the NLA and NLL II regular season champions were not so dominant—the competition in those leagues was much stronger, from top to bottom. Once again, the MILL years of NLL II (1987-96) find the least competitive years of competitive lacrosse, particularly after Canadians began playing in a league that was originally designed employ only collegiate field players from the United States. The “modern” NLL II era (1997 to present) has had some significant fluctuations in CI—from a hyper competitive CI of 25 (2013) to a not-so-competitive 75 (2004)—which will be addressed later…but the overall number in that era is what it is. (Combined with the MILL years, NLL II’s CI is 55.3
While it is true that “competitive” does not necessarily mean “high quality,” it does provide fuel for debate: would boxla fans rather enjoy a league where everyone, in every given year, has a respectable chance of winning hardware, or would they prefer something like in English soccer, where only four teams will ever win anything? An interesting question, but one best saved for another day.
Returning to the lacrosse., let’s now look at what have been the most competitive seasons in professional lacrosse history:
| Year | League | CI |
| 1975 | NLL I | 20.8 |
| 2013 | NLL II | 25 |
| 1968 | NLA | 28.9 |
| 1974 | NLL I | 36.3 |
| 1992 | NLL II | 37.5 |
| 2008 | NLL II | 37.5 |
| 2011 | NLL II | 37.5 |
Not surprisingly, when one remembers their “fully professional” nature in their short runs, the older pro leagues dominate the list—those leagues continue to be the shining examples of the greatest collection of box lacrosse talent in one place. The NLL II entries are interesting—1992, for instance, was the first year of significant Canadian participation in the then 7-team league.
Least competitive seasons in professional boxla are as follows:
| Year | League | CI |
| 1993 | NLL II | 87.5 |
| 1996 | NLL II | 80 |
| 2004 | NLL II | 75 |
| 2001 | NLL II | 71.4 |

Somewhat ironically, because NLL II has managed to survive for over thirty years, it has managed to put up some staggeringly non-competitive seasons. Unlike NLA and NLL I, the current league has managed to survive long enough to expand—and expansion teams tend to wreak havoc on CI. In 1993, for instance, the undefeated Buffalo Bandits got to fatten up on the 1-7 Pittsburgh Bulls and two 2-7 teams; in 1996, the expansion Charlotte Cobras went 0-10, providing cannon fodder for the rest of the league.

NLL II has had some sustained runs of competitive lacrosse. From 2008 to 2013, the league had a run of competitive seasons: 37.5/43.8/43.8/37.5/50/25. For no apparent reason—there was no expansion that year—2014 saw a collapse to 66.7. The 2019 season came in at 55.6. Currently, in no small part because of the ineptitude of the New York Riptide and (new) Rochester Knighthawks, the CI sits at 87.5—tied for the least competitive season ever (although that is likely to get better as the season progresses).
So what does all this get us?
With the backdrop of “relative competitiveness,” we can begin to compare teams and players from the different leagues and try to create, as much as possible, a level comparison.
The “Greatness Rating” for Teams
Regardless of sport, trying to compare teams from different eras is always problematic. Rule changes, equipment improvements, better players, and a variety of other factors make it impossible to do an apples-to-apples comparison. Does anyone really think the dominant Cleveland Browns NFL teams of the 1950s could stay on the field with even the worst modern gridiron team, for instance? In lacrosse, we have a number of problems with eras; as previously noted, equipment and tactics have changed significantly over the years.
Jovanovic recognizes the problem, and creates a formula to try to address the question of rating teams from different eras in his chapter, “By Far The Greatest Team”:
“And it’s [insert your suitably-syllabled team name here, repeat], we’re by far the greatest team you’ll ever see.” It’s a song that’s been sung for decades, mostly by fans of teams who are far from the greatest team that their opponents will ever see, it’s more a declaration of undying commitment to the cause. But who, at club level, could really sing the song with any chance of it being remotely appropriate?
For this section I decided to try to deduce the greatest club side in English football history. Bill Shankly famously said “first is first, second is nowhere,” so I’ve been through each league champion and worked out their Win Pct. Then I had to try and put each one in some kind of context because a team might win more games if they were playing against more weak teams, so I had to use the Competitive Index (CI) as previously discussed, for each season….
The calculation I decided on was a simple one. I adjusted the CI from a percentage by dividing by 100 to get it into the same scale as the Win Pcts. Then I divided the Win Pct by the CI to give me, for want of anything better to call it, the Greatness Rating of each club. If two sides had the same Win Pct but one was playing in a season which was twice as competitive as the other, the side in the more competitive division would have a greatness rating twice as big as the other one. In plain language, the teams getting the most points in the most competitive divisions are the best.
Using his “Greatness Rating,” Jovanovic determined that the 1929-30 Sheffield Wednesday side was the best single-season team in English history, with a 2.40 rating (achieved by a .740 win percentage in a league with a 29.7 CI). According to his calculations, the 1999-2000 Manchester United side was the second greatest (although I note he appears to have erroneously calculated Man U’s Win Pct that year).
The author provides some perspective for these ratings, however: this “doesn’t automatically mean that the 1929/30 Wednesday side would beat the 1999/00 Manchester United team…, but it means, at the time they played, Wednesday were ahead of a tougher bunch of opponents than United were 70 years later. But if the Wednesday players had had the same access to the training methods, equipment and nutrition that the modern players had, there is no reason to think they couldn’t beat them though.”
Who is Great in Pro Lacrosse?
Applying the “Greatness Rating” to U.S. soccer teams throughout the three eras produces some interesting results. Before we get to them, however, let’s discuss a few issues unique to pro boxla, which Jovanovic did not have to consider when creating his rating.
First, it must be recalled that “Win Pct” actually represents “percentage of available points won.” The presence of ties in soccer means that there can never be a pure “winning percentage.” However, “Win Pct” remains useful shorthand for the concept. And, because the earlier pro leagues did allow for ties, it is something we still have to contend with. Fortunately, they were so rare in NLA and NLL I (and non-existent in NLL II), that they are not much of a factor.
Second, very rarely have pro boxla leagues played balanced schedules. The NLA, for instance, was essentially two independent leagues (the Western Lacrosse Association and an eastern division) which only made one trip to play teams in the other in order to keep costs down. While, in the grand scheme of things, the advantages gained in 2018 by a team fortunate enough to play Vancouver three times instead of two is relatively slight, the edge must nevertheless be kept in mind.
Third, we are going to apply the Greatness Rating to teams that won the regular season title. In other words, champions produced by playoffs are ignored if they would not have also been the champion of a single-table league. (As noted last time, I have converted all historical standings of U.S. leagues to single, W-D-L tables, adjusting results in the latter-day NASL/early MLS where shootouts were used to break ties).
Finally, even considering that CI and “Greatness Ratings” are designed to level the playing field, the fact that NLL II been prone to considerable expansion and contraction, and varying degrees of talent pools, also makes the approach less-than-perfect. Stated another way, regardless of era we know that major league baseball was being played by the best available players in the world (putting aside the issue of the “color bar” pre-1947). Pro boxla, on the other hand, has swung from “all the best are here” to “collegiate field players only” to a variable mix of the two in the 50+ years it has been around.
Enough of the caveats—who were the teams, using this system? Following is a Top 10 list:
| Team | Season | CI | Win Pct | Greatness Rating |
| Long Island Tomahawks | 1975 | .208 | .646 | 3.10 |
| Toronto Rock | 2013 | .250 | .625 | 2.50 |
| Detroit Olympics | 1968 | .289 | .632 | 2.19 |
| Detroit Turbos | 1992 | .375 | .750 | 2.00 |
| Philadelphia Wings | 1974 | .363 | .675 | 1.86 |
| Georgia Swarm | 2017 | .389 | .722 | 1.86 |
| Calgary Roughnecks | 2011 | .375 | .688 | 1.83 |
| Calgary Roughnecks | 2009 | .438 | .750 | 1.71 |
| Buffalo Bandits* | 2008 | .375 | .625 | 1.67 |
| New Jersey Saints | 1987 | .500 | .833 | 1.67 |
(*--the New York Titans had identical numbers that year, but Buffalo has been deemed the “regular season champion” by virtue of greater Goals For, fewer Goals Against, and a better Goal Differential)
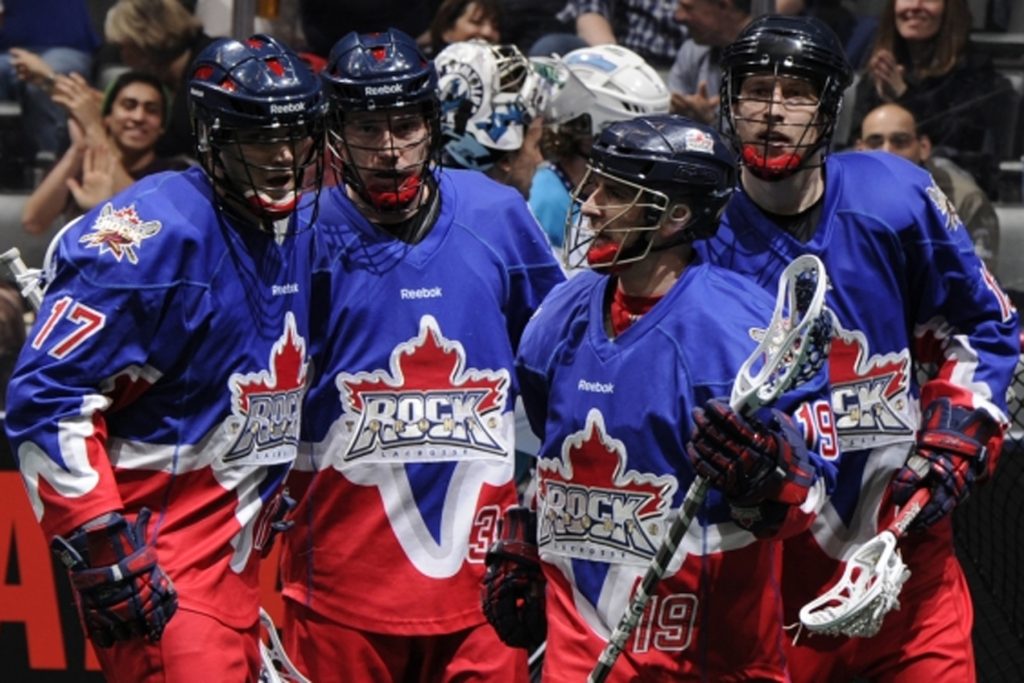
All good teams, to be sure—but there is one common theme here. As it turns out, the greatest regular season teams of all time tend to come up short in the playoffs. Of these ten teams, only Buffalo (2008), Calgary (2009), and Georgia (2017) managed to win it all…although Detroit (1968) and Philadelphia (1974) at least made it to the finals.
Also interesting to note that, of these teams, only one (Long Island—1975) was a defending champion (note: as Rochester Griffins in 1974). So it is not as if some of these great teams were riding the momentum of a title into the new season, dominated, and then just lost the desire to repeat in the playoffs.
The presence of some of these teams on the list should not be surprising. The Detroit Olympics, for instance, were essentially the professional version of the Oshawa Green Gaels, a club in the midst of a seven consecutive Minto Cup run. Coached by the legendary boxla visionary Jim Bishop, and featuring such legendary players as Gaylord Powless, Ross Jones, Merv Marshall, Larry Lloyd and (briefly, before the Philadelphia Flyers ordered him to stop playing) Doug Favell, Detroit was a real force in the 1968 NLA…only to lose in the finals to a New Westminster side that had finished .500.

Some may question a formula that gives a .625 team like the 2013 Toronto Rock (10-6-0) a Greatness Rating of 2.5, while the undefeated 1993 Buffalo Bandits only get a 1.14 and do not even approach the list. Again, the difference is level of competition. The presence of three really weak teams in 1993 meant that Buffalo had an easier path to its 8-0 season. In other words, winning 62.5% of the points available in a more competitive league is a feat much more impressive than winning 100% in a dismal one.
Does all this really mean that a 1993 Buffalo team featuring extremely talented players like John Tavares, Jim Veltman, and Derek Keenan would get thumped by a 1987 New Jersey Saints team made up of a group of field lacrosse players relatively new to the indoor game? Probably not…but, ultimately, we’ll never know. However, we do know that, throughout a season, New Jersey was able to do more against tougher competition. So who knows?
In the end, some of these results are surprising—and, frankly, raise as many questions as answers. For instance, while the concept of “Competitive Index” and its use to determine “Greatness Ratings” for teams is helpful, the fact is the quality of players in professional box lacrosse over the years over the years has been too random to allow a reliable era-to-era comparison of teams. For example, high CI that season or no, there is no way that the 1987 New Jersey Saints would stay on the field with an undefeated Buffalo team that played in a statistically less-competitive season.
History wonk that I am, I was not satisfied with the ultimate results, and wanted to try to come up with other ways at looking at teams from other eras. Having exhausted Jovanovic’s models—and not clever enough to come up with any on my own—I had hit a dead end.
Hockey to the rescue, eh?
Then I remembered one of my favorite books involving hockey.
As far back as the 1980s, I was frustrated by the fact hockey did not provide the statistical orgasms baseball could. Apparently, I wasn’t alone—Jeff Klein and Karl Eric Reif had the same frustrations, prompting them to write the seminal work on statistical analysis of hockey, The Hockey Compendium (McClelland & Stewart, Ltd., 2001 (2d Ed.)).
The Compendium introduced a lot of new concepts—“adjusted” plus/minus to take into account the “rising tide floats all boats” effect a bad player might enjoy with a good team, for instance. One of those concepts—using save percentage instead of GAA as a true measure of goaltender ability—is now universally applied in leagues around the world.
Klein and Reif did not limit themselves to evaluating individual player performance. They also tried to tackle the same age-old questions we are: which teams were the greatest of all time. So let’s take a look at some of those concepts now, and see what they can tell us about the great pro box lacrosse teams of the past
The winningest teams
The Compendium starts with a most basic concept—best “winning percentage.” Of course, we remember from last time that, in a sport with ties (like lacrosse (at least in some seasons) and hockey (although they are now “shootout losses”), “winning percentage” really means “percentage of available points won.” Either way, it’s a good measure of success, and allows comparison across seasons that did not contain the same numbers of games.
The following is a list of the Top 10 regular season finishes based on Win Percentage—note that it is not limited to league champions or teams that won the overall regular season standings.
| Rank | Team | League | Season | W-L | PCT |
| 1 | Buffalo Bandits*§ | MILL | 1993 | 8-0 | 1.000 |
| 2 | Edmonton Rush* | NLL II | 2014 | 16-2 | .889 |
| 3 | Rochester Knighthawks* | NLL II | 2007 | 14-2 | .875 |
| Albany Attack* | NLL II | 2002 | 14-2 | .875 | |
| Philadelphia Wings*§ | MILL | 1995 | 7-1 | .875 | |
| Philadelphia Wings | MILL | 1993 | 7-1 | .875 | |
| 7 | New Jersey Saints* | Eagle | 1987 | 5-1 | .833 |
| 8 | Colorado Mammoth* | NLL II | 2004 | 13-3 | .813 |
| Rochester Knighthawks | NLL II | 2002 | 13-3 | .813 | |
| 10 | Detroit Turbos* | MILL | 1991 | 8-2 | .800 |
| Philadelphia Wings* | MILL | 1996 | 8-2 | .800 | |
| Buffalo Bandits§ | MILL | 1996 | 8-2 | .800 |
(*–best regular season record; §–playoff champions)
Both as a result of the facts that NLA and NLA I did not last very long, and because of the more extreme results made possible by short seasons, NLL II (which includes the 1987 Eagle League and 1988-96 Major Indoor Lacrosse League) completely dominates this list. (For the record—Detroit Olympics had the best winning percentage in 1968 (.632); Philadelphia Wings in 1974 (.675); Long Island Tomahawks in 1975 (.646)
Also, in a continuing indictment of playoffs as a means to determine a league champion, note that only three of these teams won the playoffs.
When winning isn’t enough—The most devastating teams
As noted earlier, using straight Win Percentage is useful, but deceiving—we have already seen how some of these teams ran up their records in shockingly uncompetitive seasons. In fact, the Compendium acknowledges as much, mentioning a “Spread Of Competition” factor (using the exact formula Jovanovic used for his “Competitive Index”). Reif and Klein did not try to use their “Spread of Competition” as a multiplier against Win Pct the way Jovanovic did, however, presumably noting the inherent flaws in such an approach. Instead, they looked to other criteria to try to determine which might have been the truly strongest team.
One factor they created was the Devastation Scale. In their words:
Another thing common to the teams with the best records ever is that they led their league, or were well up among the leaders, in both offence and defence. It’s only common sense, again, really; you don’t win as consistently as those teams did by playing a one-dimensional game. It is possible, of course, to win every game by 3-2 or 4-3, although living on the edge like that would probably necessitate the team hiring an ulcer specialist by the end of the season. But were the winningest teams of all time the teams that squeaked through the tight ones night after night, or were they teams that routinely blew away the opposition and had their next opponent shaking in their skates? Well, it’s easy enough to figure out which of history’s teams crushed everything in their path; all we need to do is compare the ratio of the number of goals they scored to the number they allowed (goals-for divided by goals-against).
So which pro boxla teams wreaked a swath of destruction over the years? Here is a Top 20 list (DR = “Devastation Rating”):
| Rank | Team | League | Season | W-L | GF | GA | DR |
| 1 | Philadelphia Wings*§ | MILL | 1994 | 6-2 | 127 | 82 | 1.55 |
| 2 | Philadelphia Wings* | MILL | 1995 | 8-2 | 165 | 114 | 1.45 |
| 3 | Edmonton Rush* | NLL II | 2014 | 16-2 | 220 | 157 | 1.40 |
| 4 | Edmonton Rush§ | NLL II | 2015 | 13-5 | 241 | 177 | 1.36 |
| Buffalo Bandits§ | MILL | 1995 | 8-2 | 173 | 127 | 1.36 | |
| 6 | Detroit Turbos* | MILL | 1991 | 8-2 | 184 | 136 | 1.35 |
| Detroit Turbos* | MILL | 1992 | 6-2 | 95 | 80 | 1.35 | |
| 8 | Toronto Rock* | NLL II | 2001 | 11-3 | 168 | 125 | 1.34 |
| 9 | Buffalo Bandits*§ | MILL | 1993 | 8-0 | 143 | 108 | 1.32 |
| 10 | Albany Attack* | NLL II | 2002 | 14-2 | 252 | 194 | 1.30 |
| Saskatchewan Rush*§ | NLL II | 2018 | 14-4 | 254 | 196 | 1.30 |
(*–best regular season record; §–playoff champions)

Once again, we have a list dominated by teams from the current NLL—which, again, is as much a function of longevity as it is of skill and ability. For those keeping score, the DRs for the other two leagues were: Detroit 1.16 (1968), Philadelphia 1.19 (1974), and Long Island 1.14 (1975).
The Philadelphia Wings devastating two year run at the top of the list is no doubt attributable to the presence of the Gait brothers in their prime (although only Gary in 1995); the fact that Buffalo’s 1995 team also makes the Devastation Top 10 gives you an idea of how weak that season was (80 on the CI); indeed, the 1993 Boston Blazers just missed cracking the list with a 1.28 DR.
Also, once again: being devastating during the regular season does not necessarily translate into championships. Only half the list won the NLL title; however, 4 of the remaining 5 at least made it to the finals. So maybe offense counts more than defense, after all.
As noted at the very beginning of this treatise, an “apples-to-apples” comparison of different teams in different eras is always going to be difficult, if not impossible. But the use of these analytics at least give us a basis for comparison…and, more important, discussion.
But there is an even more useful result of this exercise: by “weighting” different seasons and eras, we now have the tools to start comparing players, and seeing how the stars of yesterday might fare, statistically, in today’s 18 game schedule. That will be an article in the near future.
Thoughts? Feel free to light up the comments.

